Live Quote

Leave your message


Holygrail

I've been looking for the Holygrail in forex for the rest of my life. Recently I really found it.

"The real holygrail in forex is to understand there is no holygrail."

That's it. The one who are able to understand what's that mean will really find the holygrail.

- BlueDreamFx-


Visitors

Hit Counter

Thursday, March 25, 2010

Thursday, March 18, 2010

No Spesific Rule


This indicator (you can download from the following link) is not using RED BLUE trigger to trade... but it most likely give the information on the market current situation. There is NO SPECIFIC RULE to enter the market as long as the market price action that I know didn't come in the discrete form (maybe I'm wrong). The sophisticated mechanism to handle the market behavior couldn't be programmed.

It still always need interaction from human to identify the market scenario. The 'program' just calculate things faster than human but it doesn't have an ability to learn from past and present scenario. We have found that so many traders who tried to create the Specific Rule to enter the market base on combination of indicators will sooner or later fail. (You may or may not agree with me. It just my opinion.)

The only things are 'Buy on Dips' and 'Sell on Rally'.

Download Link :

MatrixRVer1.0

Wednesday, March 17, 2010

Stock Market Viewer


This is the simple program to make it ease to monitor the Stock Market from your desktop.

You can download here :

StockMarketViewer

Reference : Relation Between Stock Market And Forex

Wednesday, March 3, 2010

So far so good


So far so good.
The indicator to identify 'Trend', 'Entry' and 'Pattern' combined with Sell High- Buy Low technique.

p/s : Need more testing and observation.

Sunday, February 28, 2010

Evolution Continue


Who are going to believe that the indicator as you can see from the above screenshoot is just basic candle. No sophisticated formula or miracle prediction included. It just comparison between High and Low of the candle.

I haven't seen such as laziest person as programmer... always want the job to be done in the simple way. Become a lazy person... it's good actually. It's make your mind more innovative

P/s : The version not yet released. It still under testing...

Thursday, January 28, 2010

Realize The Truth


For a long time I was believed there was something so called the miracle system, the one touch for green pips system, the perfect signal or what ever you want to called it. Something that I must found out.

But recently I found that there's no such thing. I'm satisfied enough with what I've done in my research. It doesn't meant that I'm already gave up... but it's the truth. It's not easy for me to accept that thing but I have to.

There are only three things needed toward the professional trader... Basic Knowledge, Money Management and Control Emotion. Control Emotion is the most important of all. Stick to the rule and don't believe on any speculation. Define your own risk and let your system run during your trading session.

Again, thanks to Sifu for waked me up from my dream.

"Do not try to bend the spoon ... that's impossible. Instead, only try to realize the truth ... there is no spoon." - The Matrix

Monday, January 25, 2010

Volume and High Low Average

This is just statistically way to analyze chart by using simple calculation. Please refer the above picture.

Properties :
UsePeriod ---> What time frame you want to use. You may use Daily or Weekly (Default is Daily)
PeriodCount ---> How many Days or Weeks to get the average (Default is 5 Days)

Download Link :
BDVolAndHilo.mq4
BDVolAndHilo.ex4

Thursday, January 21, 2010

Currency Domination


This is the additional indicator to support FullHouse indicator. I called it DominanIndex indicator. It derived from FullHouse indicator, using the same method but presented in the different form. It's still little bit hard to measure the domination of the currency manually by looking at FullHouse indicator. That's why the DominanIndex indicator is going to work.

It calculate the index of strength for the single currency base on comparison between EUR, GBP, USD and JPY. Those currencies are variables in an equation. One at a time each variable must be solved and countered.

Signal :
+ve, currency is strong
-ve, currency is weak
The strongest index number is 6.

For example:
JPY strong --> base JPY pair Down (BEARISH)
JPY weak --> base JPY pair Up (BULLISH)
EUR strong --> quote EUR pair Up (BULLISH)
EUR weak --> quote EUR pair Down (BEARISH)

Download Link:
DominanIndex

Sunday, January 17, 2010

Forex & Stock Market


The Relationship Between the Stock Market and Forex Markets

The equity market can impact the currency market in many different ways. For example, if a strong stock market rally happens in the U.S., with the Dow and the Nasdaq registering impressive gains, we are likely to see a large influx of foreign money into the U.S., as international investors rush in to join the party. This influx of money would be very positive for the U.S. dollar, because in order to participate in the equity market rally, foreign investors would have to sell their own domestic currency and purchase U.S. dollars. The opposite also holds true: if the stock market in the U.S. is doing poorly, foreign investors will most likely rush to sell their U.S. equity holdings and then reconvert the U.S. dollars into their domestic currency - which would have a substantially negative impact on the greenback. This logic can be applied to all the other currencies and equity markets around the world. It is also the most basic usage of equity market flows to trade FX.

Saturday, January 16, 2010

Update Version Release


Review

Before you use this indicator you must understand how it work as I told you before... the program on machine calculate faster than human. The purpose of this indicator is to find the best timing to enter the market. The overview is sentiment and psychology on market, the war between Buyer and Seller.

It base on the last 2 or 3 candles formation. You can refer here ---> http://bluedreamfx.blogspot.com/2009/03/story-behind-candle-part-3.html

What I mean by correlation on this indicator
Correlation must relate to at least one 'QUOTE' and one 'BASE' from the other pairs.

For example :
If (EURUSD up) And (GBPJPY up) And (EURJPY up) then EURJPY is said to be correlated up because the changes synchronized with Quote and Base currency from another pairs.

As result we get 'up',' dn', 'BUY', 'SELL' signal referred as correlated signal. '*' and '**' as uncorrelated signal.
Where 'BUY', 'SELL' and '**' indicate that the formation of last candles seems like entry pattern while 'up', 'dn' and '*' is just continuation pattern.

Whats new
1. As I mentioned before... the sign of Risk Aversion or Risk Appetite by 'Yellow Arrow'. Refer here ---> http://bluedreamfx.blogspot.com/2010/01/risk-aversion.html
2. The double star '**' uncorrelated entry pattern or formation.

Download Link
1) FullHouseEx2Plus
2) MTF candle time and mq4 source (feel free to modify it for your convenience)

*******************************************************
How to use :
In order to get the valid signal, for the first run of this indicator,
please update UJ, EJ, GJ, EU, GU and EG from m5 to mn1.
*******************************************************


Little bit about history/evolution
I've created many indicators just like any other indicator, using formula or combination of formulas to give RED BLUE signal but this one for me is unique. The RED BLUE signal will became unusable or irrelevant as the biggest scenario of market changed. For example the Weekly Time Frame change from trending to sideways market the RED BLUE signal will no longer give valid signal. But 'the story' will never expired because 'the story' is not signal. It just tell what's happen on the market at the moment.

This 'story' has evolved three times.
1. Fractal BBF indicator - List down 72 probabilities of candles formation. Reference : http://bluedreamfx.blogspot.com/2009/03/story-behind-candle-part-2.html
2. MarketSentiment indicator - Focus only on entry and continuation patterns. The 'story' still very noisy. Reference : http://bluedreamfx.blogspot.com/2009_02_08_archive.html
3. FullHouse indicator (the latest evolution) - Filtered with Multi Pairs in order to get the real sentiment.

Future Expansion
I might expanse this project to add AUD, NZD, CAD and CHF currency in future, but first I have to do some observation on the current version.

Thursday, January 14, 2010

Understand the conditions + Instinct ...

Understand the conditions + Instinct = Right Decision Making

Indicator is not everything that you need. It just help you to calculate something faster than manual... to capture the changes faster than your eyes can do. So that you can understand what's going on Just In Time.

One of the greatest mistake of the trader is using RED BLUE signal as primary guide to enter the market. Unfortunately, there is no perfect formula to predict the market or sophisticated mechanism to handle the risk. Sooner or later the calculation and prediction of the indicator will fail.

Trade like a Big Dog is not just to understand but to feel the market behavior. So that you know the right time to enter the market.

p/s at least you feel and act the way the Big Dog do even though you are just a cat

Tuesday, January 12, 2010

Risk Aversion


Risk aversion is a concept in economics, finance, and psychology based in the behavior of humans (especially consumers and investors) whilst exposed to uncertainty.

Risk aversion is the reluctance of a person to accept a bargain with an uncertain payoff rather than another bargain with a more certain, but possibly lower, expected payoff. For example, a risk-averse investor might choose to put his or her money into a bank account with a low but guaranteed interest rate, rather than into a stock that may have high returns, but also has a chance of becoming worthless.

http://en.wikipedia.org/wiki/Risk_aversion

Risk appetite, by contrast, is likely to shift periodically as investors respond to episodes of financial distress and macroeconomic uncertainty. In adverse circumstances, investors will require higher excess expected returns to hold each unit of risk and risk appetite will be low—it is the inverse of the price of risk. And when the price of risk is taken together with the quantity of risk inherent in a particular asset, the expected return required to compensate investors for holding that asset is the risk premium.


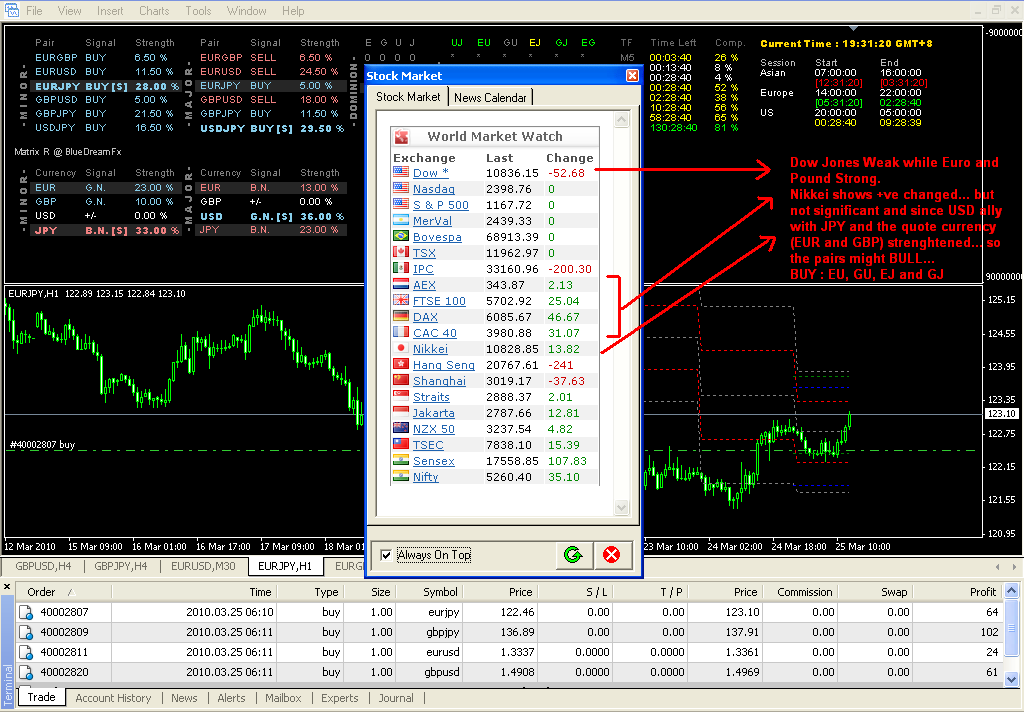
I've modified the FullHouse indicator to determine or to captured the sign of Risk Aversion (or Risk Appetite). The yellow arrow come out (refer the above picture) whenever base USD or base JPY suddenly become strong and the movement direction is opposite each other.

p/s The version not yet release. Stay tune.

Friday, January 8, 2010

FullHouse Indicator : User Guide

What is FullHouse indicator all about?
It's all about sentiment and psychology on market base on reversal or continuation patterns on last candle. It tell the story on what's happen on the market at the moment. You might get clue from the story whether to enter or stay out from the market, to close or to hold your position.

Basic Rule on reading the reversal pattern

"A trend reversal signal implies that the prior trend is likely to change, but not necessarily reverse. This is very important to understand. Compare an uptrend to a car traveling forward at 30 m.p.h. The car's red brake lights go on and the car stops. The brake light was the reversal indicator showing that the prior trend (that is, the car moving forward) was about to end. But now that the car is stationary will the driver then decide to put the car in reverse? Will he remained stopped? Will he decide to go forward again? Without more clues we do not know."

Steve Nison
JAPANESE CANDLESTICK CHARTING TECHNIQUES
A Contemporary Guide to the Ancient
Investment Techniques of the Far East
Chapter 4 : Reversal Patterns

FullHouse Reversal and Continuation Pattern
Forget about shooting star... forget about harami... forget about dark cloud cover. Everything about the name. A lot of things to remember. You will understand nothing by reciting on your mind the "Name". If you look closely to the pattern you will come out with the criteria of reversal pattern. There is only one or two type of reversal pattern. Please refer the following picture.


You also can refer the criterias from here --> Story behind the candle part 3

But...

As what you can understand from the Steve's philosophy of Reversal Patterns... the pattern is only the early sign or clue... not necessary true unless you understand the whole process of chart.

Solution

Therefore, in order to use the point of reversal as well as the point of entry effectively... you might define your own Support and Resistance level, understand how far the price could go and estimate the swing base on previous history. For example you might ignore the "BUY" signal if the price is relatively high.

One more thing
We will never get the perfect entry all the time. However we still can profit all the session of trading. However if you could always get the perfect timing to enter the market anyway... it's good for you

Wednesday, January 6, 2010

Best Entry Point, Only Human Can Do It


This is my best entry point for today. SELL at the highest point of the price as well as counted trend entry, in order to get some pips as the price is going to test the previous SnR. This could not be done by machine(EA). Only human can do it.

p/s Sorry for breaking your rule sifu mfazy121. You've told me to keep low profile. It's only for this time. I'm so excited...

Indicator : Update FullHouse


Download Link :
FullHouseEx

Another update. This could make you understand what's going on on the market


Download Link :
FullHouseEx2
 
Disclaimer :
The content of this blog is for 'Forex Trading Journal' purpose only. Nothing on this site should be construed as recommendation to purchase any financial instruments. The choice and risk is always yours. Thank you.